
Spotify Analytics: analyzing music, artists and trends with data
Music is data too. In this walkthrough, I use a Spotify song dataset to answer concrete questions: How is popularity distributed? Which genres lead? What makes a song popular? Does each style have a recognizable audio signature? Everything is explored in a reproducible notebook.
01 The data
I used the Spotify Tracks Dataset (a public Kaggle dataset): thousands of songs with their popularity (0–100), their genre and the audio features that Spotify calculates for each track:
- Danceability: how suitable it is for dancing, based on rhythm, beat and regularity.
- Energy: intensity and activity—metal scores high, a ballad scores low.
- Valence: how positive or cheerful it sounds.
- Acousticness: the probability that the track is acoustic rather than electronic.
The notebook tries to load the real CSV. If it is unavailable, it generates a sample dataset with the same schema so anyone can run it without downloading anything.
def load_data():
    for file in ("spotify_tracks.csv", "dataset.csv"):
        if os.path.exists(file):
            return pd.read_csv(file)   # real Kaggle data
    return generate_sample()           # fallback with the same schema
02 Popularity is concentrated
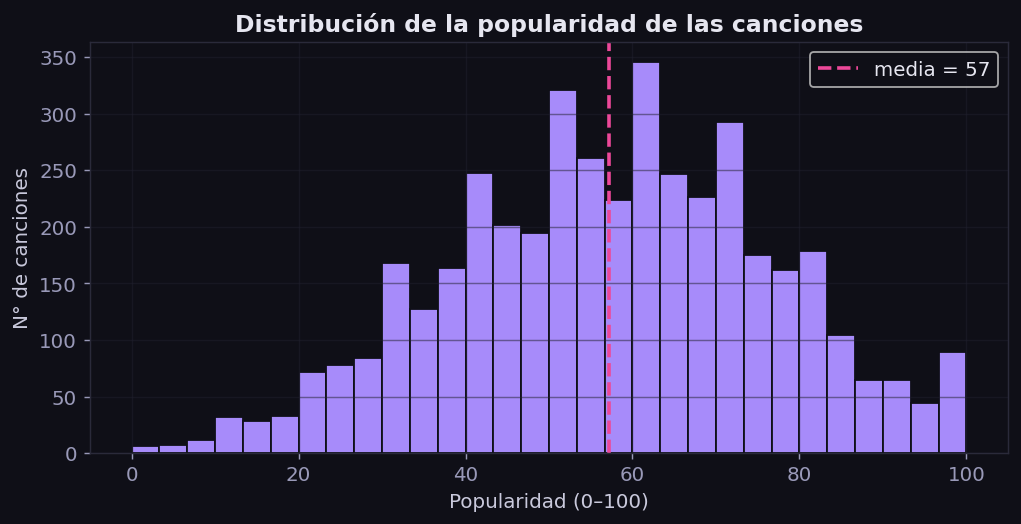
The first step is to examine how popularity is distributed. The shape tells the story: there are many average-performing songs and very few hits. The distribution has a long right tail: major success is rare, which is precisely why it is so valuable.
03 Which genres lead
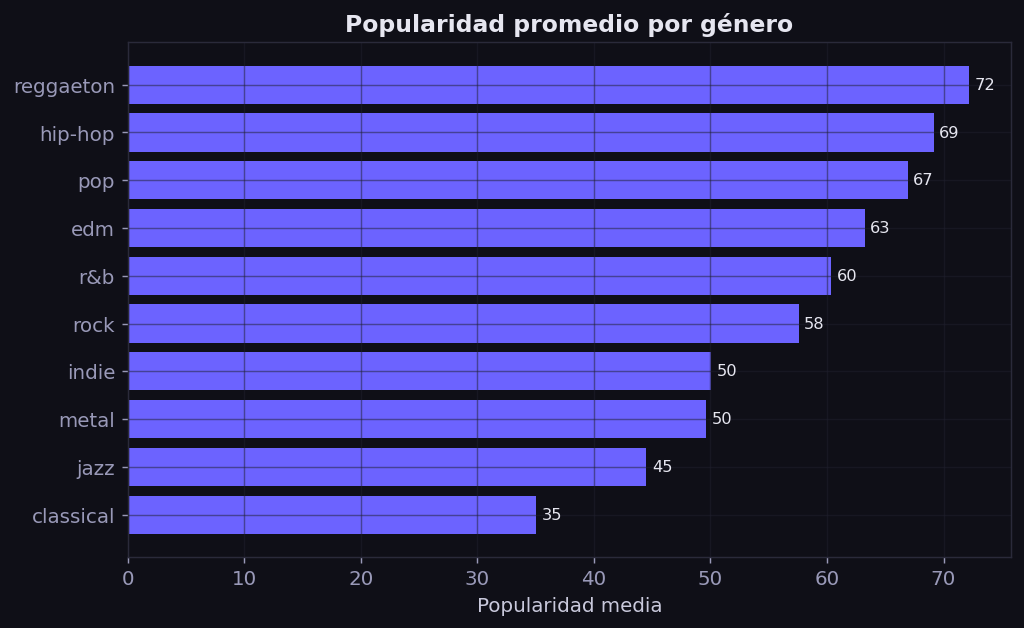
When average popularity is calculated by genre, a familiar pattern appears: more danceable, mainstream styles such as reggaeton, hip-hop and pop lead, while more niche or attentive-listening genres such as jazz and classical rank lower. That does not make them “worse”; average popularity measures mass reach.
04 What makes a song popular?
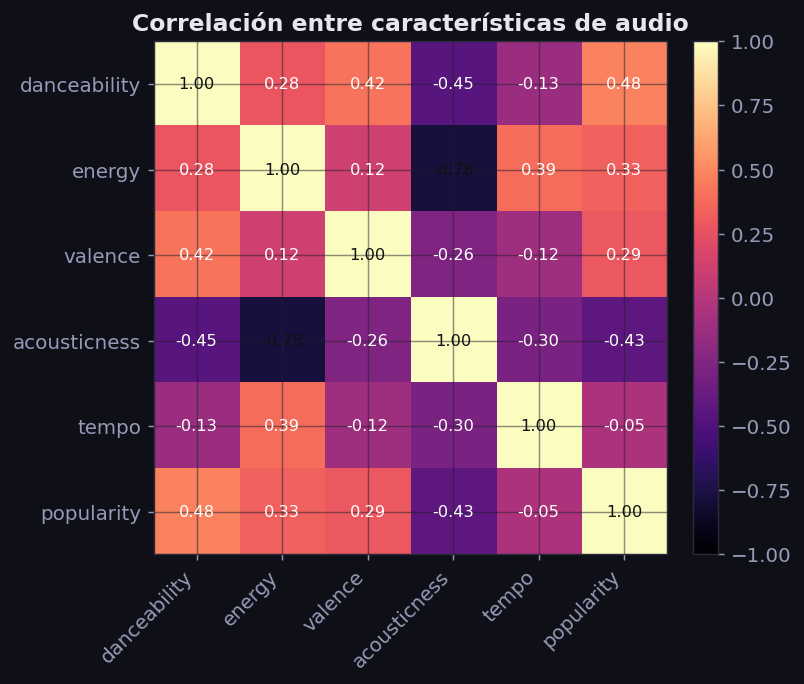
This is where it becomes interesting. Comparing every feature with popularity in a correlation matrix shows that danceability and energy are most positively associated with popularity, while acousticness moves in the opposite direction. Correlation is not causation—raising the BPM is not enough to create a hit—but it does indicate the direction of music with mass reach today.
05 Each genre has an audio signature
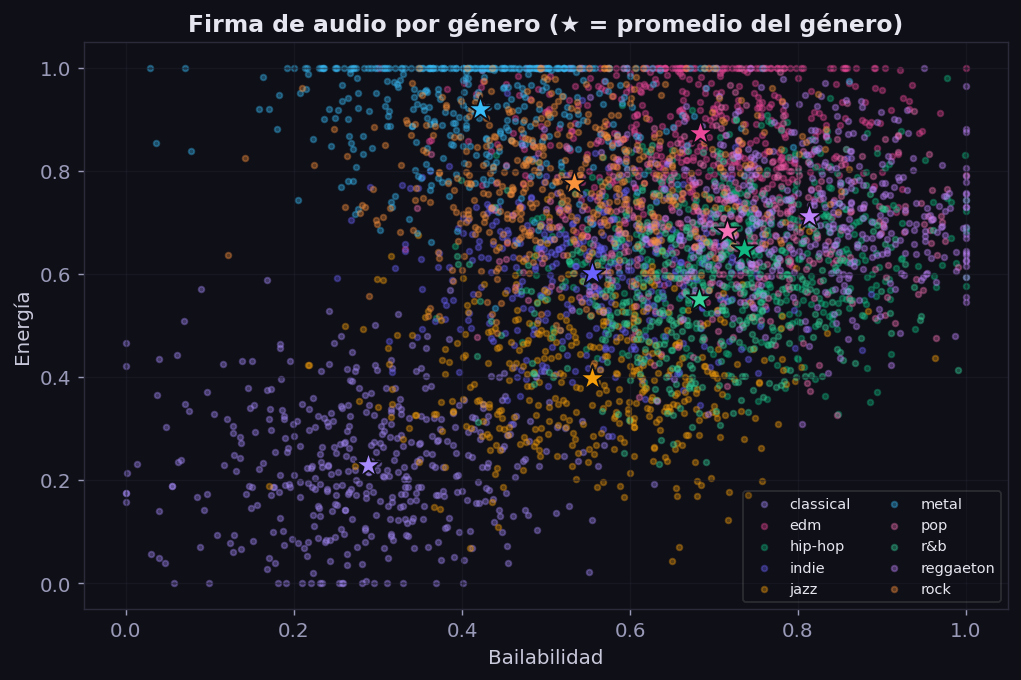
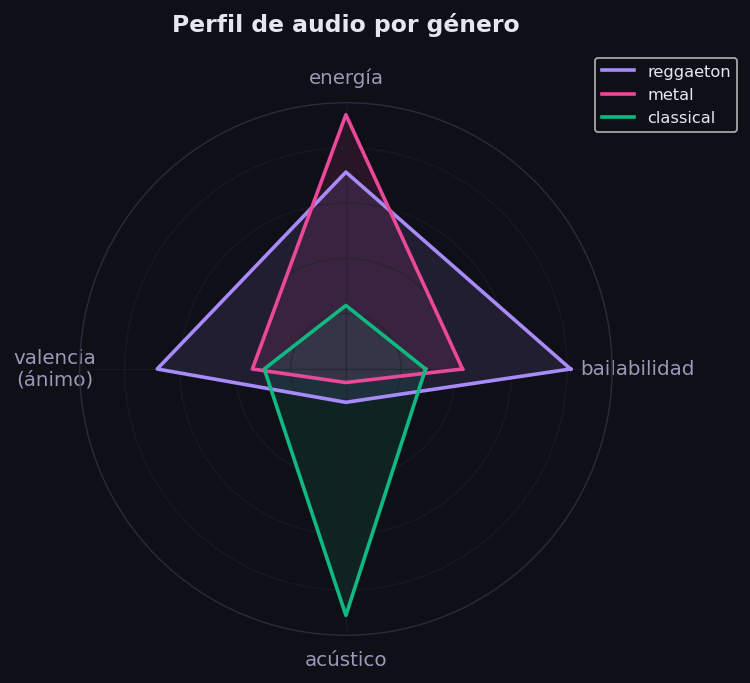
What I liked most was that when every song is plotted on a map of energy versus danceability, genres separate naturally. Metal and EDM sit high on the chart because of their energy, reggaeton and pop move to the right because of their danceability, and classical music sits toward the lower left. The data “sees” stylistic differences without being explicitly told what they are.
Comparing the complete profiles of three very different genres makes the contrast even clearer: reggaeton scores high in danceability, metal in energy and classical music in acousticness.
Conclusions
With only a few questions and charts, a music dataset tells a clear story:
- Popularity is concentrated in a small number of tracks: many average songs, few hits.
- Danceability and energy are the features most associated with mass success; acousticness shows the opposite pattern.
- Each genre has a recognizable audio signature that can be separated using data.
The best part is that it is reproducible: the same notebook runs with the real Kaggle CSV or with sample data. It is the same way I would approach any dataset—yours or your business’s—by asking questions, cleaning, visualizing and drawing conclusions while clearly stating the limits.
Do you have data you want to explore?
Sales, surveys, music or anything else—I can turn them into charts and decisions. Let’s talk.
Let’s talk → Download the notebook (.ipynb)